Monitoring💣
The primary way to access/view data collected by Cluster Auditor is through its metrics.
Prometheus💣
Cluster Auditor is automatically shipped with a ServiceMonitor with allows Prometheus to scrape its metrics port. These metrics can be viewed in Prometheus if desired via the following metrics names:
opa_scorecard_up: Basic metrics that validate the monitor is functioningopa_scorecard_constraint_information: Provides details of allConstraintscurrently deployed in the cluster (name, kind, violations, and enforcement type)opa_scorecard_constraint_violations: Provides granular detail on all violations (the offending pod/ns, the constraint, enforcement type, and message)
Grafana💣
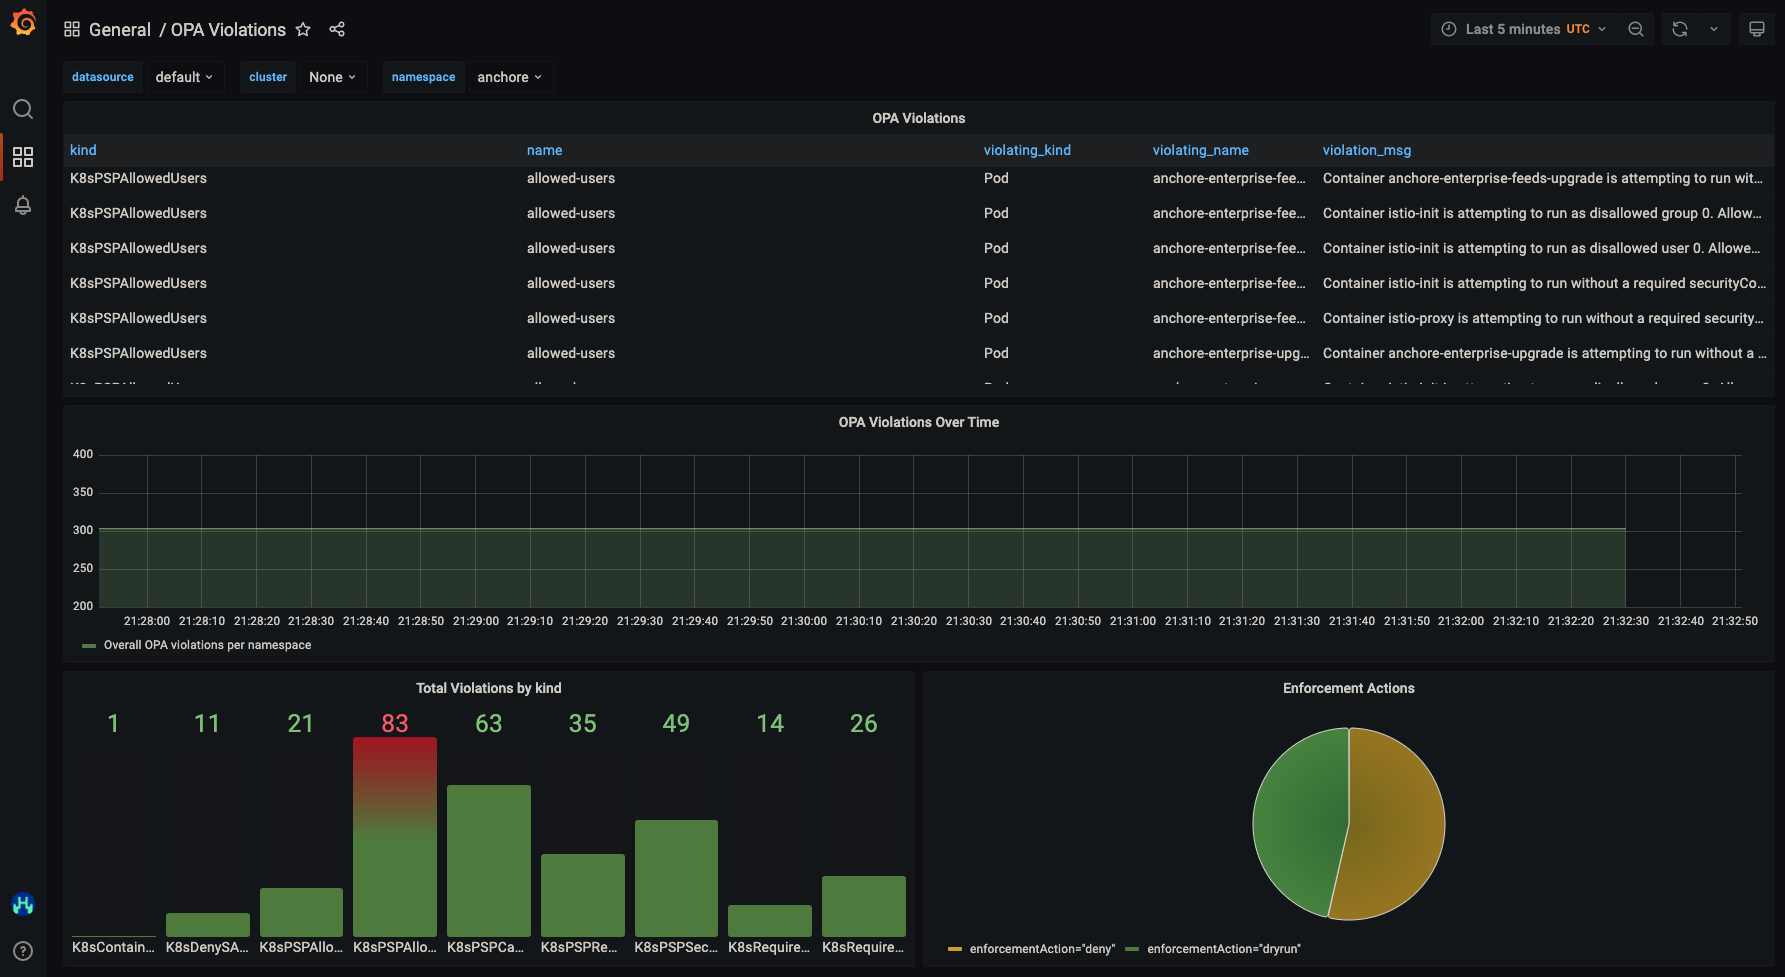
The easiest way to view Cluster Auditor data is through the pre-configured Grafana Dashboard OPA Violations.
This dashboard displays (per namespace) all violations, with filtered graphs and charts based on violation type, time, and enforcement action. The image below provides a preview of what this dashboard looks like in an example cluster.

Last update:
2022-01-25 by Micah Nagel